
I mentioned this a few months ago in my Thanksgiving blog…I am not a football person. It might seem strange that I am writing yet again about the sport, but Super Bowl Sunday sewage is just so interesting! With a score of 43-8, I’m pretty sure even some football fans found this year’s game to be a little dull. So instead of a play-by-play breakdown, I’m going to analyze the game from the perspective of your sewer. Yeah, I know, way more interesting. In last year’s sewer sociology blog, I gave you the first sneak peek into HRSD’s sewer system during the Super Bowl. If you’ve been waiting since then for another chance to see through the eyes of your sewer – your wait is over!
Why is this so interesting? Well, most of the time sanitary sewer flows follow a predictable pattern. For example, residential flow is normally higher during the daytime when we are awake, peaking in the morning as most of us get ready for work and after we get home in the evening. However, these patterns can be thrown off by various events and the Super Bowl is one such event. I work for HRSD, which maintains more than 500 miles of pipes and 13 wastewater treatment plants across Hampton Roads. More than 1.6 million people flush and send their wastewater to us every day, and it’s our job to make sure that wastewater is cleaned before it’s released into local waterways. To help ensure the proper collection and treatment of our region’s wastewater, we analyze data from over 200 flow meters throughout our system. We know when you flush.
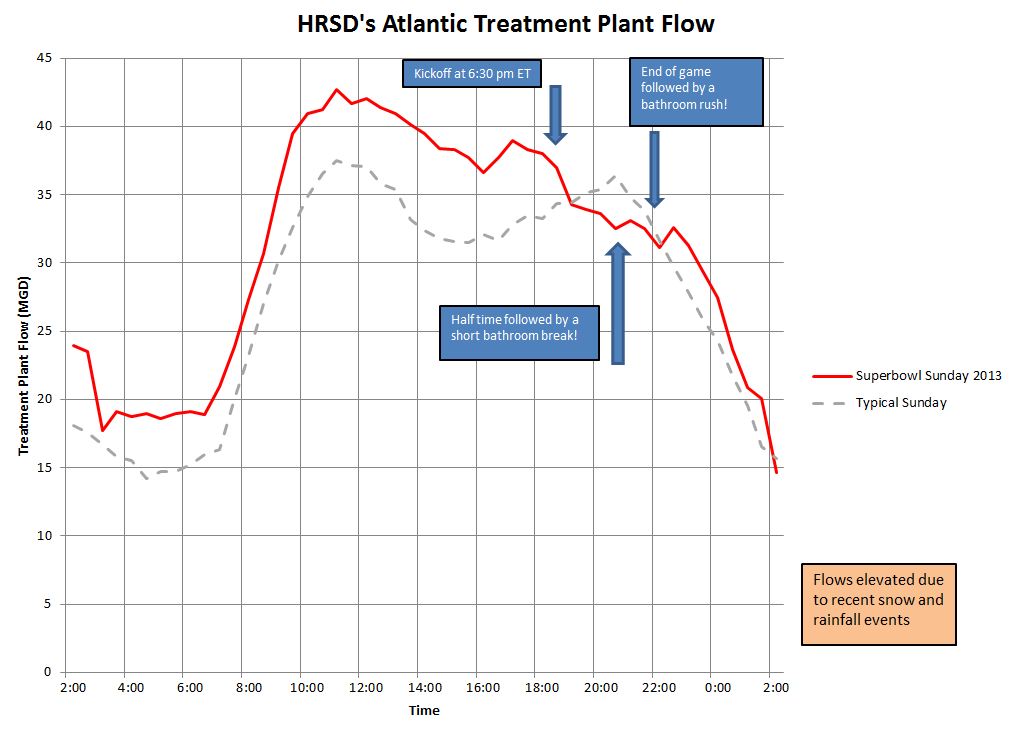
Super Bowl flow at HRSD’s Atlantic Treatment Plant.
So what did we see on Super Bowl Sunday? This year, we took a look at HRSD’s Atlantic Treatment Plant in Virginia Beach (click graph to enlarge), which cleans wastewater from areas in Virginia Beach and Chesapeake. Typical Sunday flow is shown in grey, and Super Bowl Sunday flow is shown in red. After kickoff, treatment plant flow dropped while fans stayed glued to the TV. Even I was watching the game (OK, the commercials) at this point. The increase in flow around 9 p.m. was probably the halftime bathroom rush. I did not contribute to this one; instead I was glued to Bruno Mars rocking the halftime show! I hope you didn’t stay in the bathroom too long, it was quite the performance. The largest increase in flow happened right after the end of the game, which suggests some serious synchronized flushing. If you were holding it until the end, that could be your flush. My interest fizzled in the 4th quarter and I’m pretty sure I was asleep before the game ended. Maybe if the game had been a little closer I would have held it until the end, too.
Now that you know how much of an impact your bathroom habits have on the sewer system, make sure you also know what not to flush. Please don’t use your toilet as a trash can – it can lead to untreated sewage backing up in your home or into our streets where it can enter storm drains and waterways. HRSD always keeps an eye on the sewer but we need your help to protect our waterways. Your flush counts!